Introduction #
Any operating system will generate a memory dump upon a system crash to assist users in the debugging of their machine. These dumps typically just contain a small snippet of memory relevant to the crash, but what if the operating system provided more than that? In Windows, you can instruct the operating system to dump your entire system’s memory, allowing for analysis of drivers, programs, and any other component in memory, regardless of anticheat-related protections. In this article, I will explain how to force Windows to generate these system-wide memory dumps, and some ways to utilize the dump in WinDbg and Python.
Generating the dump #
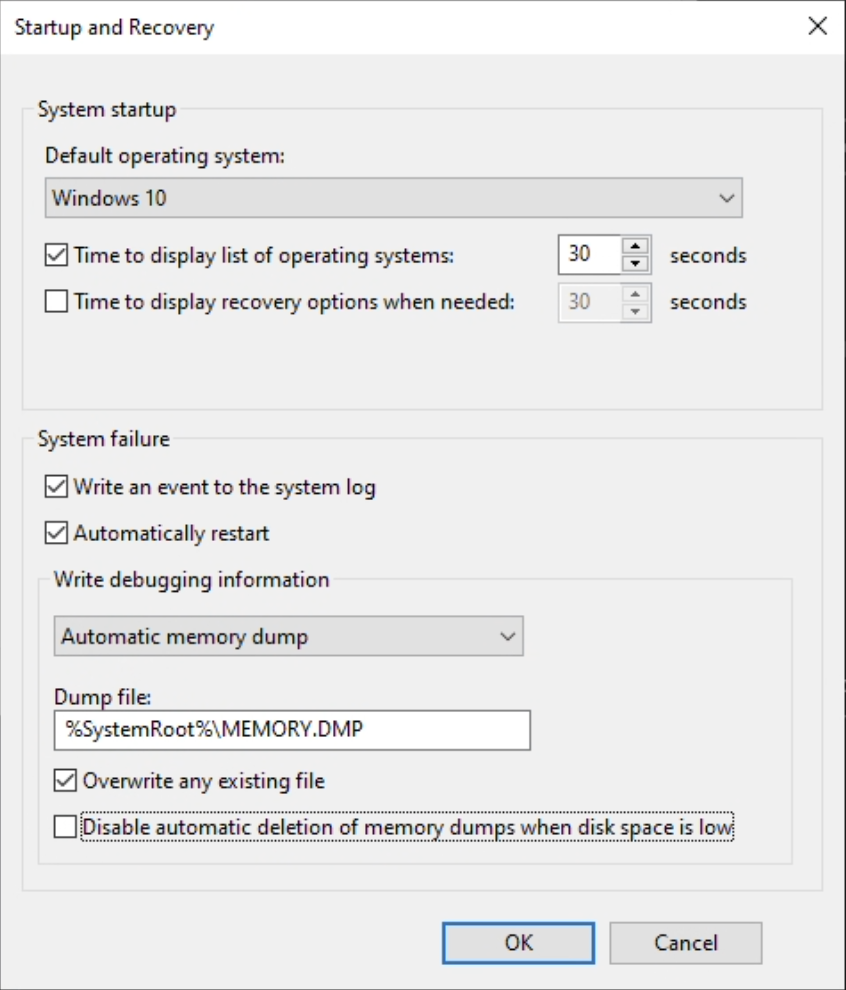
On Windows 10, crash dumps typically only include what the operating system deems necessary for analysis; however, via Windows settings, you can change this to a full memory dump. This means that the operating system will dump the entire system’s memory (even unused memory) to the disk. You can configure the Windows crash dump system via
- Settings -> Search “View advanced system settings” -> Settings button under “Startup and Recovery”
- CMD -> Run “SystemPropertiesAdvanced” -> Settings button under “Startup and Recovery”

From here, change the dropdown under “Write debugging information” to Complete memory dump. If prompted, you will have to restart your machine for the changes to take effect. Once restarted and ready, open the target process or load the target driver you want to dump and force a BSOD. You can force a BSOD using numerous methods, but I just personally run the wininit command in an administrator powershell. Once your machine goes through the full post BSOD process, you should have a memory dump at the location provided in your settings. If you don’t see your dump, check the Event Viewer application for errors.
Using the dump #
The dump can now be used in a program like WinDbg to inspect the memory. To load the dump into WinDbg, just drag the dump into the WinDbg process. To dump drivers, you can open the dump in WinDbg, and run the lm ok command. From here, locate your driver via a CTRL+F search and use the following command with the parameters as shown below
.writemem [full path] [start] [end]
Your binary should’ve been written to the disk. To fix the dump, use a tool like PE Dump Fixer or manually fix the dump using a tool like CFF Explorer.
You can also utilize this dump to exploit in games. For example, in Rust, I have written a Python script to dump the game’s memory whilst next to an enemy’s base, and from there read the game’s memory via the dump to generate a map of my enemy’s base (I personally export it to Fortify) for efficient raiding. For this programmatic interfacing, I use the pykd library in Python, but there are also various other libraries and tools for other languages.